| Oracle® Enterprise Manager Concepts 10g Release 1 (10.1) Part Number B12016-01 |
|
|
View PDF |
| Oracle® Enterprise Manager Concepts 10g Release 1 (10.1) Part Number B12016-01 |
|
|
View PDF |
This chapter introduces the concept of application performance management and contains the following sections.
Today's e-businesses depend heavily upon their Web applications to allow critical business processes to be performed online. As more emphasis is placed on accessing information quickly, remotely, and accurately, how can you ensure your online customers can successfully complete a transaction? Are you certain that your sales force is able to access the information they need to be effective in the field?
Enterprise Manager Application Performance Management tools are a major shift in system diagnostics and monitoring. With Application Performance Management tools, you can proactively monitor your e-business systems from the top down and trace the experience of your end users as they enter and navigate the Web site. Additionally, with the knowledge of real end-user response times, you are able to effectively manage your e-business systems and understand the impact of application performance problems. Application Performance Management tools also provide detailed diagnostics that allow you to quickly and easily identify the root cause of the application performance problems.
Application Performance Management functionality complements the traditional systems monitoring capabilities of Enterprise Manager. Full integration with the Enterprise Manager systems monitoring capabilities allow you to monitor the performance and availability of system components that make up the applications' technology environment, including the back-end database and the middle-tier application servers.
The key Application Performance Management monitoring capabilities are described in the following sections:
This section contains the following topics:
The availability of your Web applications is critical to the success of your business. However, the rules for what constitutes availability can vary widely from one application to another.
For example, for one Web application, you might measure availability in terms of how well the login page performs for your users. For another application, such as an online store, you might measure availability in terms of a successful sales transaction.
In fact, a Web application can sometimes be available to some users and not to others. A customer in Tokyo might have problems accessing your Web site while a user in New York might have no trouble at all. Using Enterprise Manager, you have the flexibility to define application availability for your unique environment.
Enterprise Manager continuously monitors the availability criteria you specify and generates alert notifications when predefined performance thresholds are exceeded. When Enterprise Manager generates an alert, you can drill down to locate the availability problem quickly.
In addition to automatic notification of performance issues, Enterprise Manager also provides real-time information for each Web application. At any time, you can review the status of your Web applications with real-time charts and availability icons that show you the status of the application and individual pages or sets of pages on your Web site.
Setting up your Web application so it can be monitored by Enterprise Manager is as easy as creating a Web application target. To create a Web application target, use the Grid Control and perform the following steps:
Click Targets.
Click Web Applications.
On the Web Applications page, click Add.
Provide the needed information in the Create Web Application wizard.
|
See Also: "Creating Web Application Targets" in the Enterprise Manager online help |
To review existing Web Application targets:
Click Targets in the Enterprise Manager Grid Control
Click Web Applications.
Click the Web Application of your choice.
See Figure 3-1 for an example of a Web Application home page.
Figure 3-1 Enterprise Manager Web Application Home Page
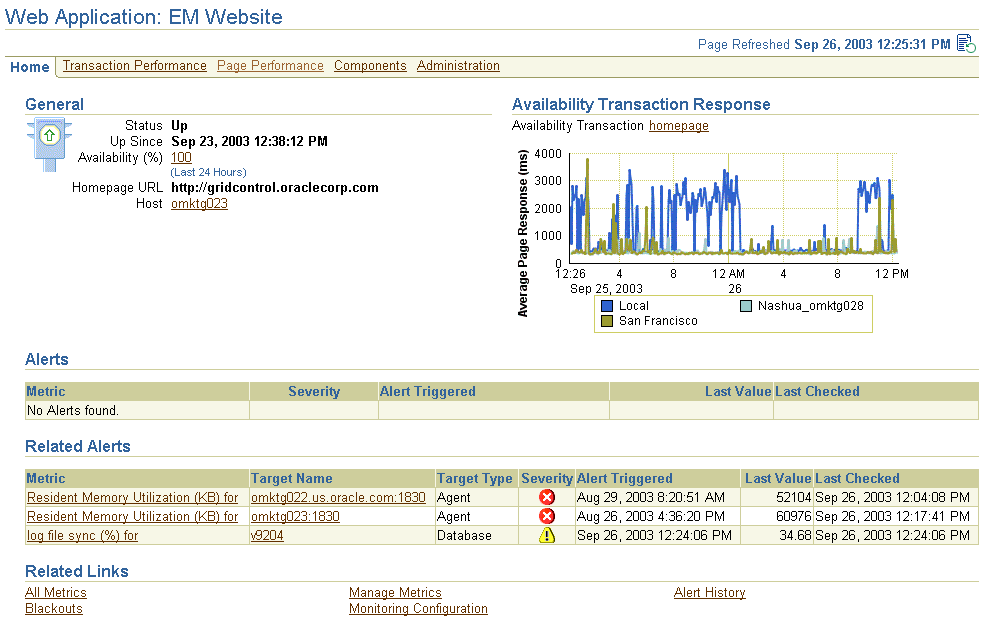
In fact, Enterprise Manager itself is a Web application. As a result, the installation procedure automatically creates a Web application target called EM Website (Figure 3-1) that you can use as an example of Application Performance Management in action. From this Web Application Home page, you can monitor the availability and performance of the Enterprise Manager Web application.
|
Note: At any time while reviewing the Enterprise Manager Web application, click Help for more information. |
From the Web Application Home page, you can quickly become familiar with the Web application. In particular, notice the Homepage URL field in the General section of the page.
The Availability Transaction Response chart provides information about the availability and response time of the Homepage URL. When you create a Web application target, Enterprise Manager sets default warning and critical thresholds for how quickly the page is displayed. When the response time exceeds the response time warning or critical threshold, Enterprise Manager generates an alert. If the Homepage URL is unavailable, this Web Application will be identified as down and unavailable when you scan the list of Web Application targets in the Grid Control.
You can modify the warning and critical thresholds for the Homepage URL anytime by modifying the collection settings for the Homepage URL on the Manage Transaction settings page. To access this page:
Choose the Web application.
Click Administration on the Web Application page.
Click Manage Transactions.
On the Availability Transaction Response page, click Manage Transactions.
On the Manage Transactions page, choose the transaction to investigate and click Collection Settings.
|
See Also: "Setting Transaction Intervals and Thresholds" in the Enterprise Manager online help |
By default, the Homepage URL is checked for availability by the local host where the Management Service has been installed. To obtain more information about the performance and availability of the Homepage URL from multiple locations on the Intranet or across the Internet, you can assign special targets called Oracle Beacons to access the Homepage URL.
|
See Also: "About Beacons" in the Enterprise Manager online help |
This section contains the following topics:
Besides monitoring the availability of an entire Web application, you can also monitor the performance of specific pages or features of your application.
With Application Performance Management, you can create a recording of your Web browser actions as you access these pages. You can then save this recording—which Application Performance Management refers to as a business transaction—so you can play the transaction automatically from strategic locations throughout your infrastructure. After a period of time, you can view and compare data about the performance of the transaction from a variety of locations on the network. A breakdown of the transaction path from start to finish provides detailed information about each URL in the transaction, including response metrics for server and network components.
Enterprise Manager pinpoints the location of any performance problem, whether internal or external to the data center, and lets you know if slow response times are due to problems in your system or externally on the Internet. Issues within the data center are further broken down to reveal if they are at the network, server, content, or application level.
To become familiar with the concept of business transactions, consider the Homepage URL, which is defined when you create a Web Application target.
The Homepage URL used to monitor the availability of the Web Application is a simple business transaction that displays the Homepage URL of the Web Application. The performance of this simple transaction determines the availability of the Web Application.
Figure 3-2 shows the Homepage URL transaction as it appears in the All Transactions table on the Transaction Performance page of the Web Application target home page.
Figure 3-2 Homepage URL Transaction as Shown in the All Transactions Table

You can use the Administration page of the Web Application home page to add additional and more complex transactions. You create each transaction by recording a series of actions you take in the Web browser. Enterprise Manager provides a recording control panel and a browser window so you can record a series of actions in the browser (Figure 3-3). You then save these actions as a single business transaction that you can monitor from the Web Application Transaction Performance page.
Figure 3-3 Recording an Application Performance Monitoring Business Transaction
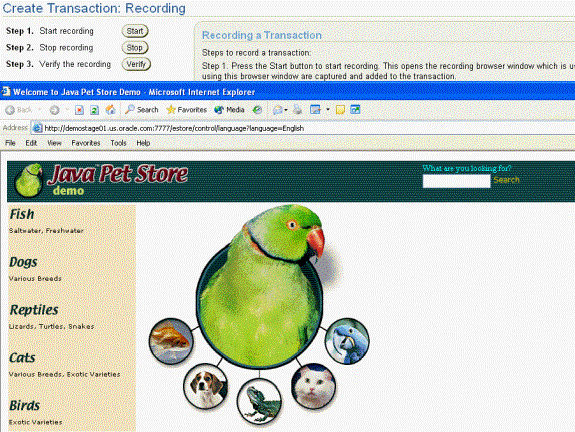
A Web application transaction can be monitored from different geographical user communities using Beacons. Beacons are client robots which have the functionality of playing transactions from various representative user communities and collecting response time data.
Figure 3-4 shows the All Transactions table after additional transactions were created for this Web Application. The table provides details about the average response time of the pages within each transaction that was played from various representative user communities.
Figure 3-4 Multiple Transactions as Shown in the All Transactions Table
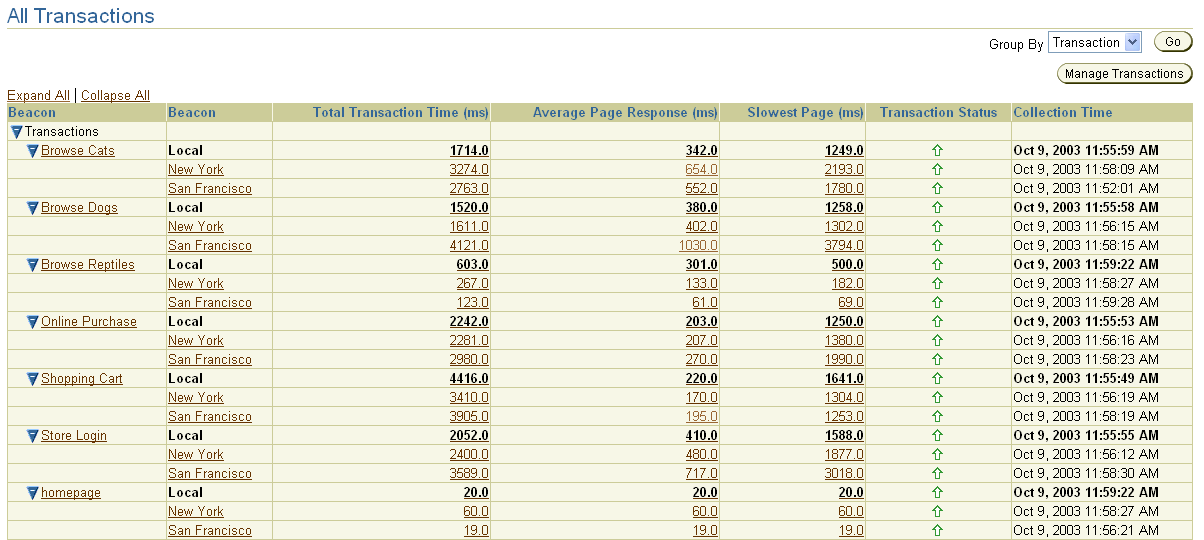
If you drill down and click the transaction name in the All Transactions table, Enterprise Manager provides details about the transaction performance, as well as a graphical breakdown of each phase of the transaction (Figure 3-5).
Figure 3-5 Drilling Down to Transaction Details

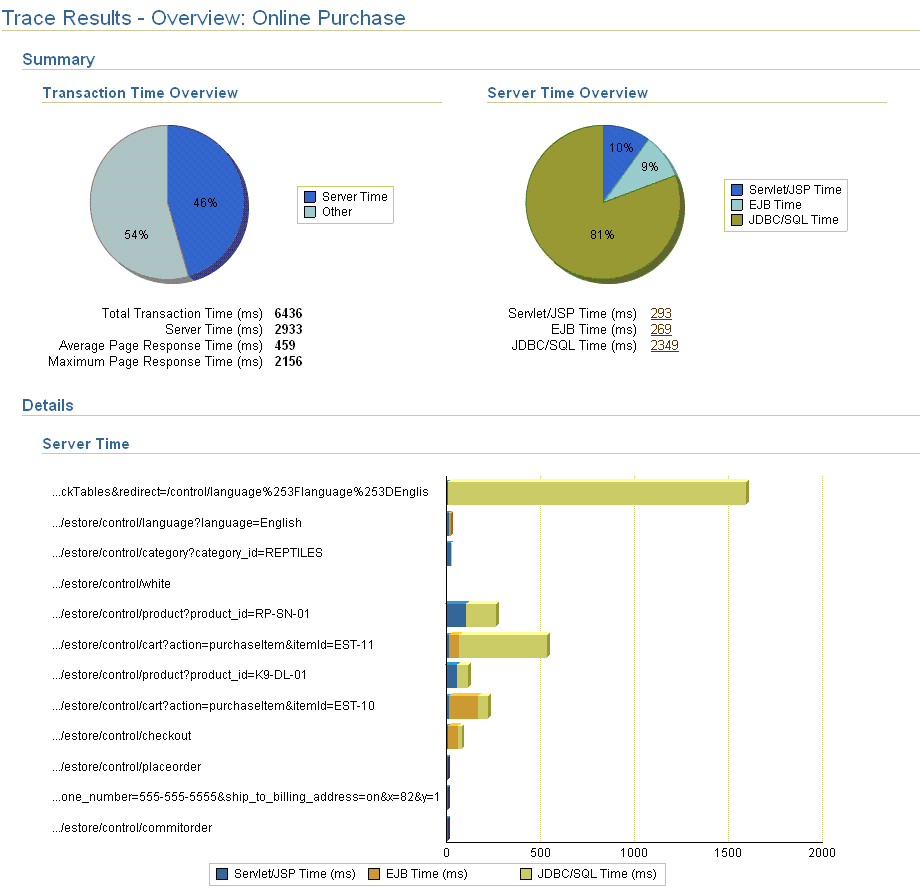
From the Manage Transactions link, you can play a transaction using the interactive trace facility. By selecting a recorded transaction and clicking Play, this trace feature allows you to execute a transaction and obtain response times for each URL within the transaction. If the transaction is a J2EE transaction that invokes components of the J2EE stack, click Play with Trace to a see a breakdown of the server times. The server time breakdown includes the servlet/JSP, EJB, and JDBC/SQL times and allows you to determine where transaction bottlenecks exist so that you can further diagnose performance problems (Figure 3-6).
|
See Also: "Extended Network and Critical URL Monitoring in Action" to learn more about Oracle Beacons |
Figure 3-6 Interactive Cross-Tier Tracing for Business Transactions
For more information about creating Web Application transactions, see the Enterprise Manager online help.
|
See Also: "Creating Transactions" in the Enterprise Manager online help |
This section includes the following topics:
Page Performance Monitoring can help you develop a clear understanding of how your Web applications are performing from the end-user perspective. This new Enterprise Manager feature collects the actual response time experienced by end users and stores this comprehensive performance data in the Management Repository. As this data is gathered over time, you can generate detailed reports that reveal exactly how well your pages are responding to user requests.
You can select individual pages (URLs) to monitor, or you can display reports that reveal Web application performance information sorted in multiple ways. For example, you can view reports that show the slowest pages on your site over the past 24 hours, the average response time experienced by particular Web site visitors, or the average response time experienced by users from specific network domains.
Knowledge of the actual performance of your application as experienced by your end users enables you to understand the impact of performance problems. This enables you to prioritize your resolution efforts on the issues that impact your business the most.
To view the page performance data for a Web application, click the Page Performance tab on the Enterprise Manager Web Application home page. By default, this page shows the slowest pages in this Web Application over the past 24 hours (Figure 3-7).
|
Note: To view end-user performance data for your own Web applications, you must not only create a Web Application target, but you must also configure the Web Caches for your Web application. |
Figure 3-7 End-User Response Time for the a Typical Web Application

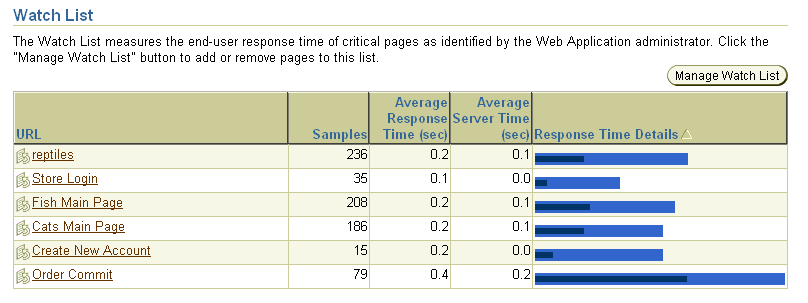
For more specific information, use the Administration tab of the Web Application home page to add the URLs that most interest you to the URL Watchlist. The watchlist provides you with a summary of the number of times the page has been accessed and the average response time of the page (Figure 3-8).
Figure 3-8 Selected Pages Shown in the Web Application URL Watchlist
In addition to End-User Response Time, the Page Performance page displays Middle Tier Performance (Figure 3-9) data.
Figure 3-9 Middle Tier Performance for a Web Application

Enterprise Manager collects detailed J2EE activity data each time a user accesses a page (or URL) of your Web Application. The processing times reflect the time needed to prepare Web application content in the middle tier, as well as the time spent in the application server and back-end data sources. You can use this data to identify the slowest URL and plan your corrective action.
In addition, for each URL you can drill down and examine the processing time and additional performance details for each servlet, JSP, JDBC, and EJB component, down to the root cause of the problem at the SQL statement level. You can also correlate the processing time and load with other factors such as the CPU, Memory, I/O, and response times and load. This correlation also includes other metrics of the components that make up your Web application. Details of the full call processing stack of every URL accessed is also provided for rapid root cause diagnosis.
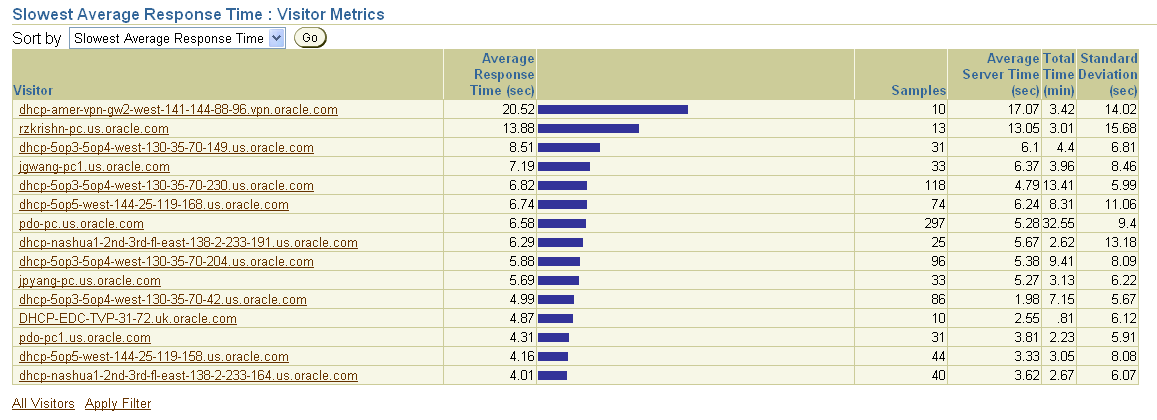
For example, Figure 3-10 shows a report that reveals which users are experiencing the slowest performance on your site.
Figure 3-10 End-User Response Time Data Sorted by Visitor
You can learn more about the end-user response time drill-down reports in the Enterprise Manager online help.
|
See Also: "About Monitoring Page Performance" in the Enterprise Manager online help |
This section includes the following topics:
The responsiveness of your network components is as critical to your Web application as the performance of your URLs. Enterprise Manager provides you with tools to monitor both continuously and on-demand.
You can define watch lists of network components and URLs that you wish to continuously monitor for availability and responsiveness. Since it is not always practical to have the management infrastructure permeate the entire application infrastructure, on-demand monitoring also allows network components that might otherwise go unmonitored to be checked periodically for responsiveness and availability.
To manage targets on each of your network hosts, you install an Oracle Management Agent. The Management Agent discovers the targets on each host and gathers management data about the hardware and software on each host.
The Management Agent also serves as an Oracle Beacon. Each Oracle Beacon can be configured to monitor the availability and performance of any:
Device on your network, such as a host computer or an IP traffic controller
Web page or Web application that is accessible from the selected Beacon
If the network device, Web page, or Web application is inaccessible, or if it does not respond within a predefined time interval, you can configure the Beacon so it generates an alert.
You can add one Beacon target for each host where the Management Agent has been installed. You add the Beacon target like any other managed target by selecting the Beacon target type and clicking Add on the Management Agent home page.
Like other managed targets, each Beacon has an Enterprise Manager home page. From the Beacon home page, you can check the HTTP response time of a remote URL or the network response or route used to contact any device that can be located with a TCP/IP network address.
For example, to check the performance of a remote URL:
From the Beacon home page, click Performance.
Scroll to the bottom of the page and enter the complete HTTP address (URL) of a Web page you want to test.
You can test Web pages on your Intranet, or configure the Beacon to use your proxy server so you can test pages outside your company firewall.
Select HTTP Response from the menu and click Go.
Enterprise Manager displays the URL Test page, which provides details about the response time of the URL, including a a graphical breakdown of the entire transaction, as shown in Figure 3-11.
Figure 3-11 Testing the Performance of a Remote URL

You can get more information about the test result data by clicking Help on the URL Test page.
To make sure the performance of a network component or URL is acceptable from multiple locations on your network, you can configure multiple Beacons to monitor the component or URL. You do this by installing Management Agents on strategically-located hosts. For each Beacon on each host, you can then add key network components and Web pages to the Network Watchlist and the URL Watchlist on the Beacon Performance page. After an item is added to the Network or URL Watchlist, you can scan the entries in the list to see:
Which components are currently available from this Beacon
If any warning or critical alerts have been triggered
A key set of metrics that can help you determine the relative performance of the connection to the component
More information about using Beacons to measure network component and critical URL availability is available in the Enterprise Manager online help.
|
See Also: "About Beacons" in the Enterprise Manager online help |